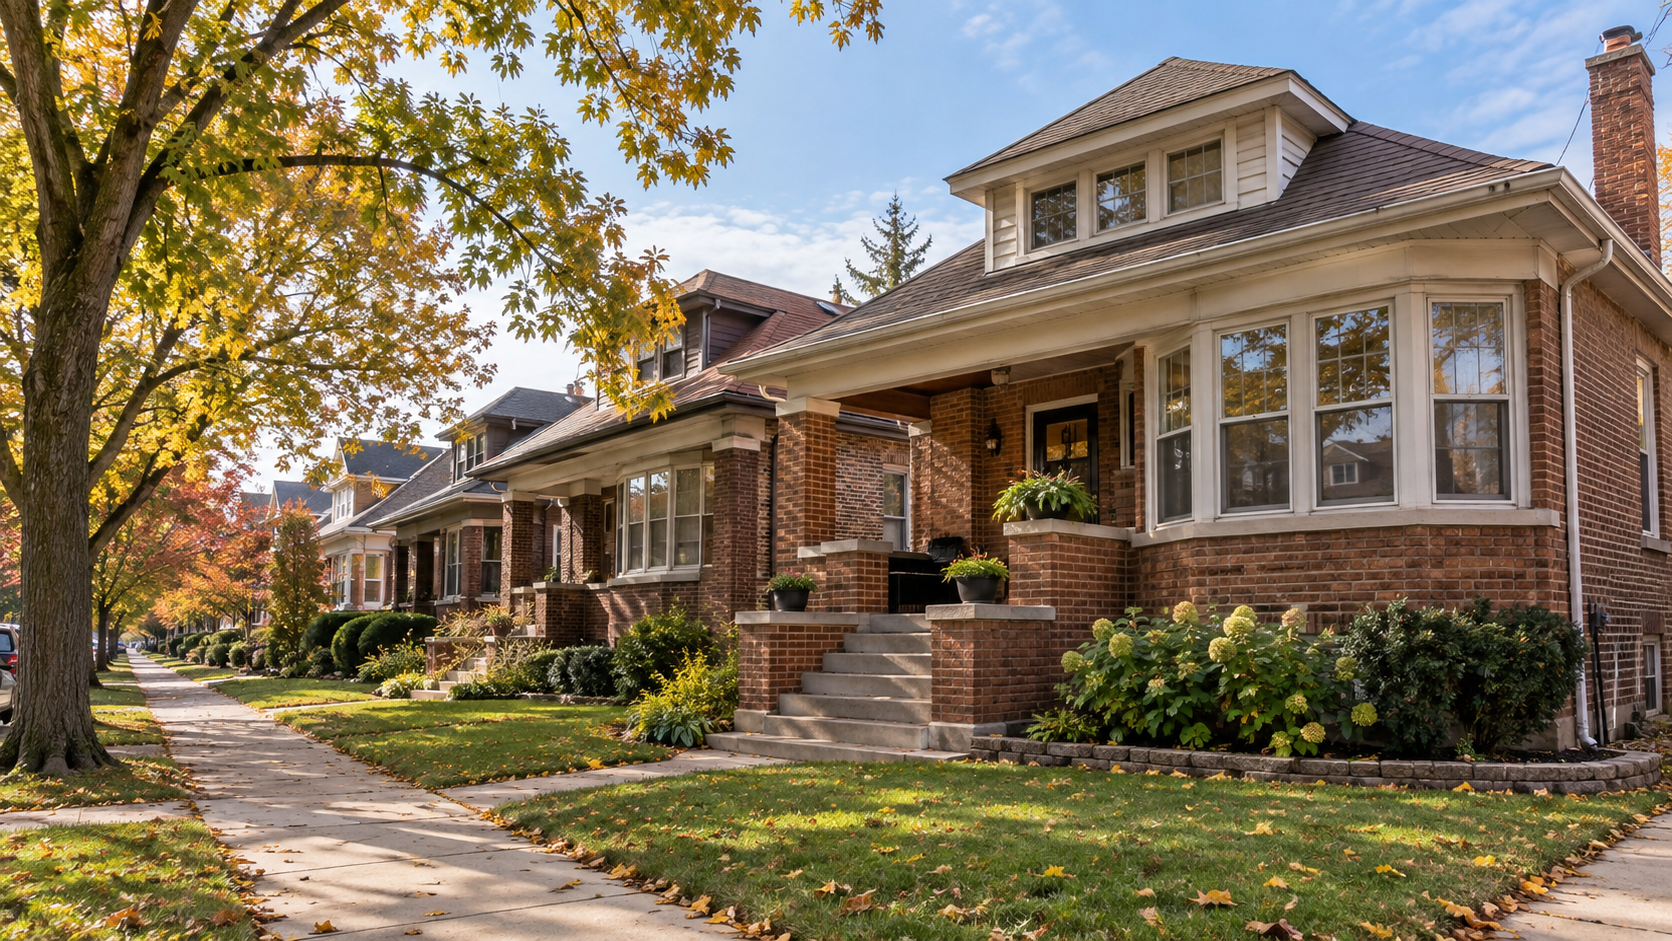
The 20-city index beat forecasts with a 2.5% gain. Owners could borrow against $11.5 trillion of equity, about 64% of their total, while mortgage rates sit near 7%.
Home prices picked up speed in July. They still lost ground to inflation.
The S&P Cotality Case-Shiller 20-City Composite rose 2.5% from a year earlier, up from 2.2% in June and ahead of forecasts near 2.2%. The national index rose 1.9%, from 1.6%, and the 10-city composite 3.4%, from 3%. On a seasonally adjusted basis, national prices rose 0.3% from June.
Consumer prices rose 3.4% over the same 12 months. Measured against that, real home values fell for a 14th consecutive month, according to S&P Dow Jones Indices. The inflation that outpaced home prices was concentrated in energy. Core inflation, which excludes food and energy, ran at 2.5%, which is still above the national home price gain.
Chicago led the 20 cities with a 6.9% annual increase. Seattle was the weakest, with prices down 1.6%. The Federal Housing Finance Agency's separate index rose 2.6% from a year earlier.
Borrowing against the house
Rising values have not turned into borrowing. The average 30-year mortgage rate was 7.03% in Freddie Mac's latest weekly survey. For owners who locked in much lower rates during the pandemic years, a second loan today would cost far more than the first.
"The borrowers with the most housing wealth are often the least likely to tap it," said Thom Malone, principal economist at Cotality. "They tend to have low mortgage rates, strong cash flow, and little reason to move."
Cotality's figures show the scale. Mortgaged owners held $17.9 trillion of equity in the second quarter. About $11.5 trillion of it, or 64%, could be borrowed while still leaving lenders an adequate cushion. Home equity lines and second mortgages rose nearly 20% from the first quarter and still added up to less than 0.1% of that borrowable pool.
A widening map
Equity is shrinking in some places. Values are falling in Texas, Minnesota, Colorado, Maryland and the District of Columbia, and owners there are losing equity. At the other end, the average owner holds more than $600,000 in Hawaii and California and more than $400,000 in Massachusetts, against a little over $100,000 in Louisiana, Oklahoma and Iowa. Appreciation is running fastest where equity is already largest, so the spread is growing. Only 2.1% of borrowers owe more than their homes are worth.
What to watch
Thursday's Freddie Mac survey will show whether mortgage rates are following the 10-year Treasury yield, which touched 5.29% on Tuesday. With long rates at multi-decade highs, the next Case-Shiller release, covering August, will show whether nominal gains keep accelerating or begin to reflect the jump in borrowing costs. Borrowing against home equity is the channel to watch for household spending. Its use remains small against the amount available.